Skip to content
Arezou Osouli

Auckland, New Zealand · Available for select projects

I turn scattered data into decisions people actually act on.

I’m Arezou Osouli, a business intelligence developer specialising in Power BI, SQL, Python, and Excel — building the pipeline from raw data to a decision someone is confident enough to act on.

Years in BI
5+
Dashboards shipped
40+
Core stack
SQL · Power BI · Python

Methodology

How I turn data into decisions

Every dashboard I ship follows the same disciplined path — from a vague business question to a decision someone is confident enough to act on. Here's the full pipeline.

  1. STEP 01

    Understand the business

    Sit with stakeholders before touching a single table — what decision are we actually trying to improve?

    Define the business question, success metric, and audience. No dashboard gets built until the decision it supports is clear.

  2. STEP 02

    Collect data

    Map every source of truth — SQL databases, APIs, spreadsheets, exports — and pull it into one place.

    Inventory sources, assess data quality and access, and set up reliable extraction (SQL, Python, connectors).

  3. STEP 03

    Clean & transform

    Fix the nulls, standardise the formats, resolve the duplicates — the unglamorous work that makes everything after it trustworthy.

    Data validation, type correction, deduplication, and transformation logic in SQL / Python / Power Query.

  4. STEP 04

    Model the data

    Design a schema that answers questions fast — star schemas, relationships, and DAX measures that hold up under scrutiny.

    Star-schema modelling, relationships, calculated columns and measures (DAX), documented business logic.

  5. STEP 05

    Build dashboards

    Design interfaces that surface the answer in seconds, not spreadsheets that require a tour.

    Power BI / interactive dashboards with clear visual hierarchy, drill-throughs, and role-based views.

  6. STEP 06

    Generate insights

    Go beyond the chart — explain what changed, why it matters, and what's likely to happen next.

    Trend analysis, anomaly detection, and plain-language narratives that sit alongside the numbers.

  7. STEP 07

    Drive decisions

    Hand over a recommendation, not just a report — and stay close enough to see it actually get used.

    Present to stakeholders, tie insights to concrete actions, and track whether the decision moved the metric.

Portrait of Arezou Osouli

Currently

Business Intelligence Developer @ Skills Consulting Group

About me

Data is only useful once someone trusts it enough to act on it.

I’m a business intelligence developer who works at the intersection of engineering and storytelling — comfortable writing the SQL that fixes a broken data model, and just as comfortable in the room explaining to a manager why a metric moved.

My background spans Power BI report development, Databricks and Unity Catalog data engineering, Microsoft Fabric, Azure cloud services, and hands-on Python and Spark analysis. I care about getting the plumbing right — clean models, documented logic, reliable refreshes — because that’s what makes a dashboard something people actually trust.

Dashboard design & storytellingData modelling (star schema, DAX)SQL & Python for analysisETL / ELT pipelinesStakeholder translation

Toolkit

Skills & tools

The stack I reach for at each stage of the BI process — from raw source to a polished, trusted dashboard.

BI & Visualisation

Turning models into interfaces people trust and use daily.

  • Power BI95%
  • DAX90%
  • Power Query (M)88%
  • Tableau70%

Data & Databases

Getting to clean, reliable data as fast as possible.

  • SQL (T-SQL / Spark SQL)92%
  • Databricks & Delta Lake85%
  • Data Warehousing82%
  • ETL / ELT Pipelines84%

Analysis & Scripting

Where automation and statistical rigour take over from spreadsheets.

  • Python (pandas, NumPy)85%
  • Excel (Advanced / VBA)90%
  • Statistical Analysis78%
  • A/B Testing72%

Cloud & Platform

The plumbing that keeps dashboards live and data flowing.

  • Azure Data Factory80%
  • Azure Data Lake (ADLS Gen2)78%
  • Microsoft Fabric68%
  • Git / Version Control75%

Selected work

Projects

Each one follows the same pipeline — a real business problem, a data solution, and a measurable outcome. Replace these with your own case studies in content/projects.ts.

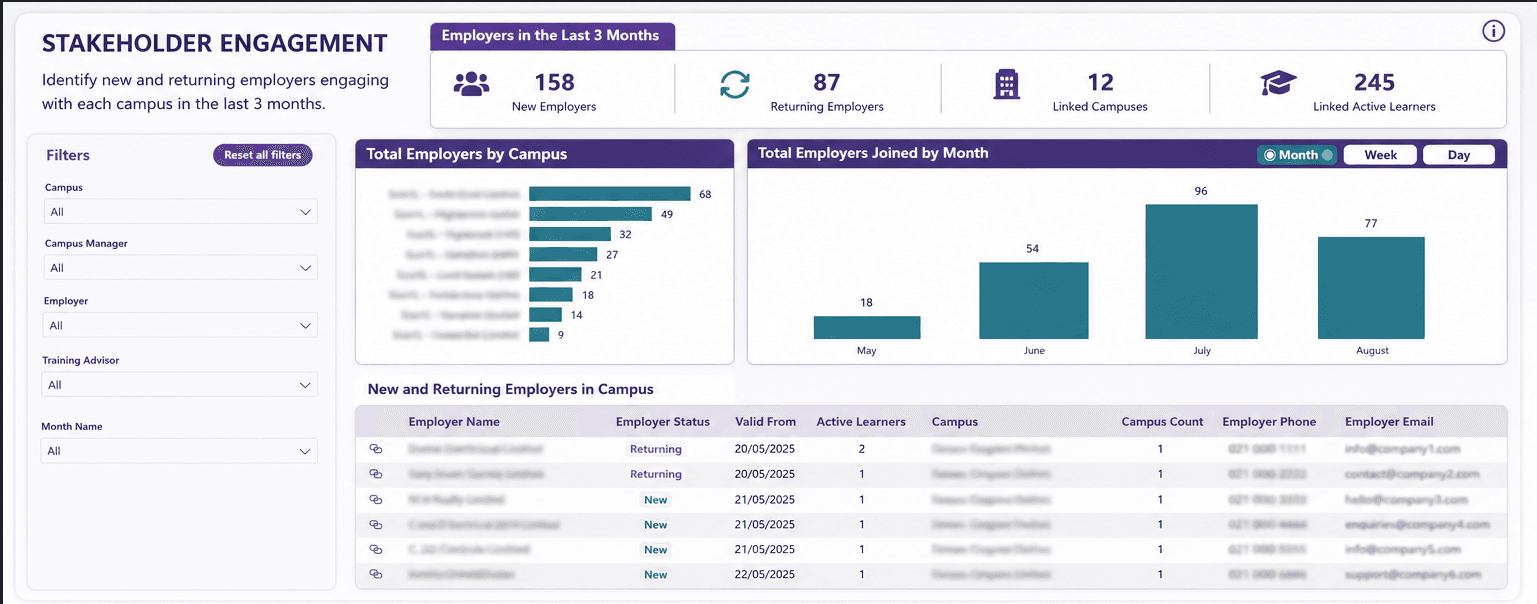
Screenshot of the Stakeholder Engagement Report dashboard

Stakeholder Engagement Report

Turning enrolment data into actionable employer intelligence.

Power BIDatabricksAzure Data FactoryDAXPower QueryData ModellingUAT
Employer classification
New vs. Returning
Adoption
Beyond original scope
Delivery
Full lifecycle to production
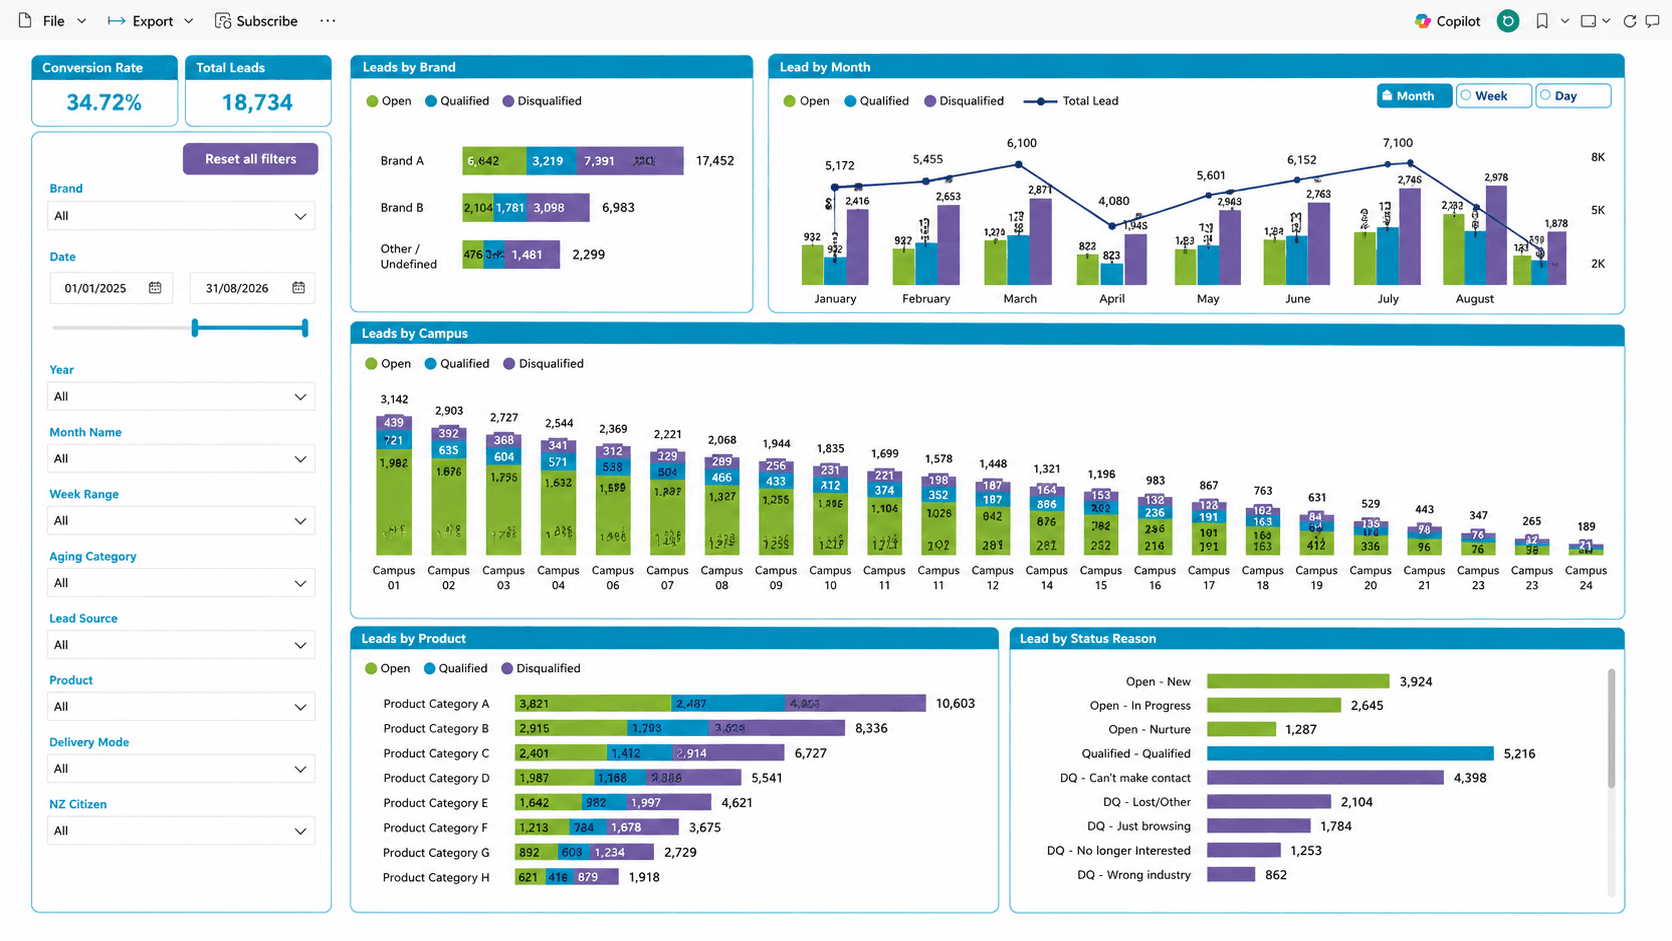
Screenshot of the Lead-to-Learner Funnel Analytics dashboard

Lead-to-Learner Funnel Analytics

A star-schema funnel report bridging CRM leads and LMS enrolments, giving marketing and admissions a single source of truth from first contact to enrolled learner.

Power BIDataverseSQLPower Query
Attribution accuracy
+34%
Monthly manual merge
Eliminated
Reporting cadence
Weekly → real-time
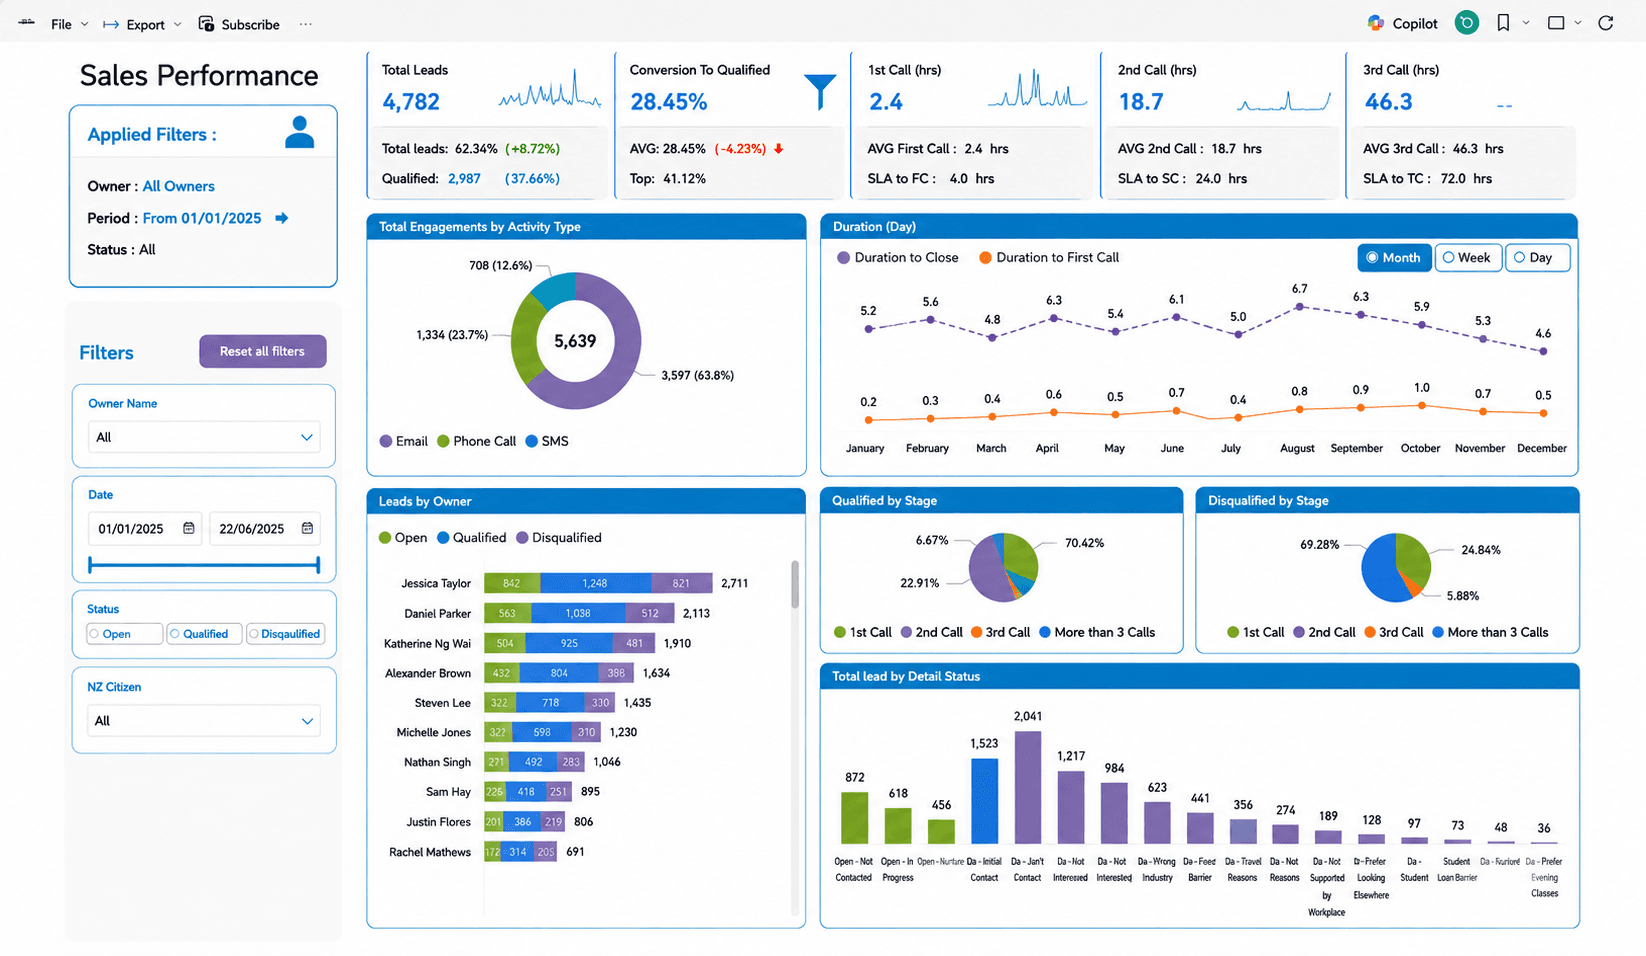
Screenshot of the Compliance Reporting Data Layer dashboard

Compliance Reporting Data Layer

A governed Spark SQL view layer over raw learner records, fixing date-handling and type issues so compliance reports could be trusted without manual patching.

DatabricksSpark SQLUnity Catalog
Reporting errors
Zero since fix
Audit readiness
Improved
Downstream views affected
4
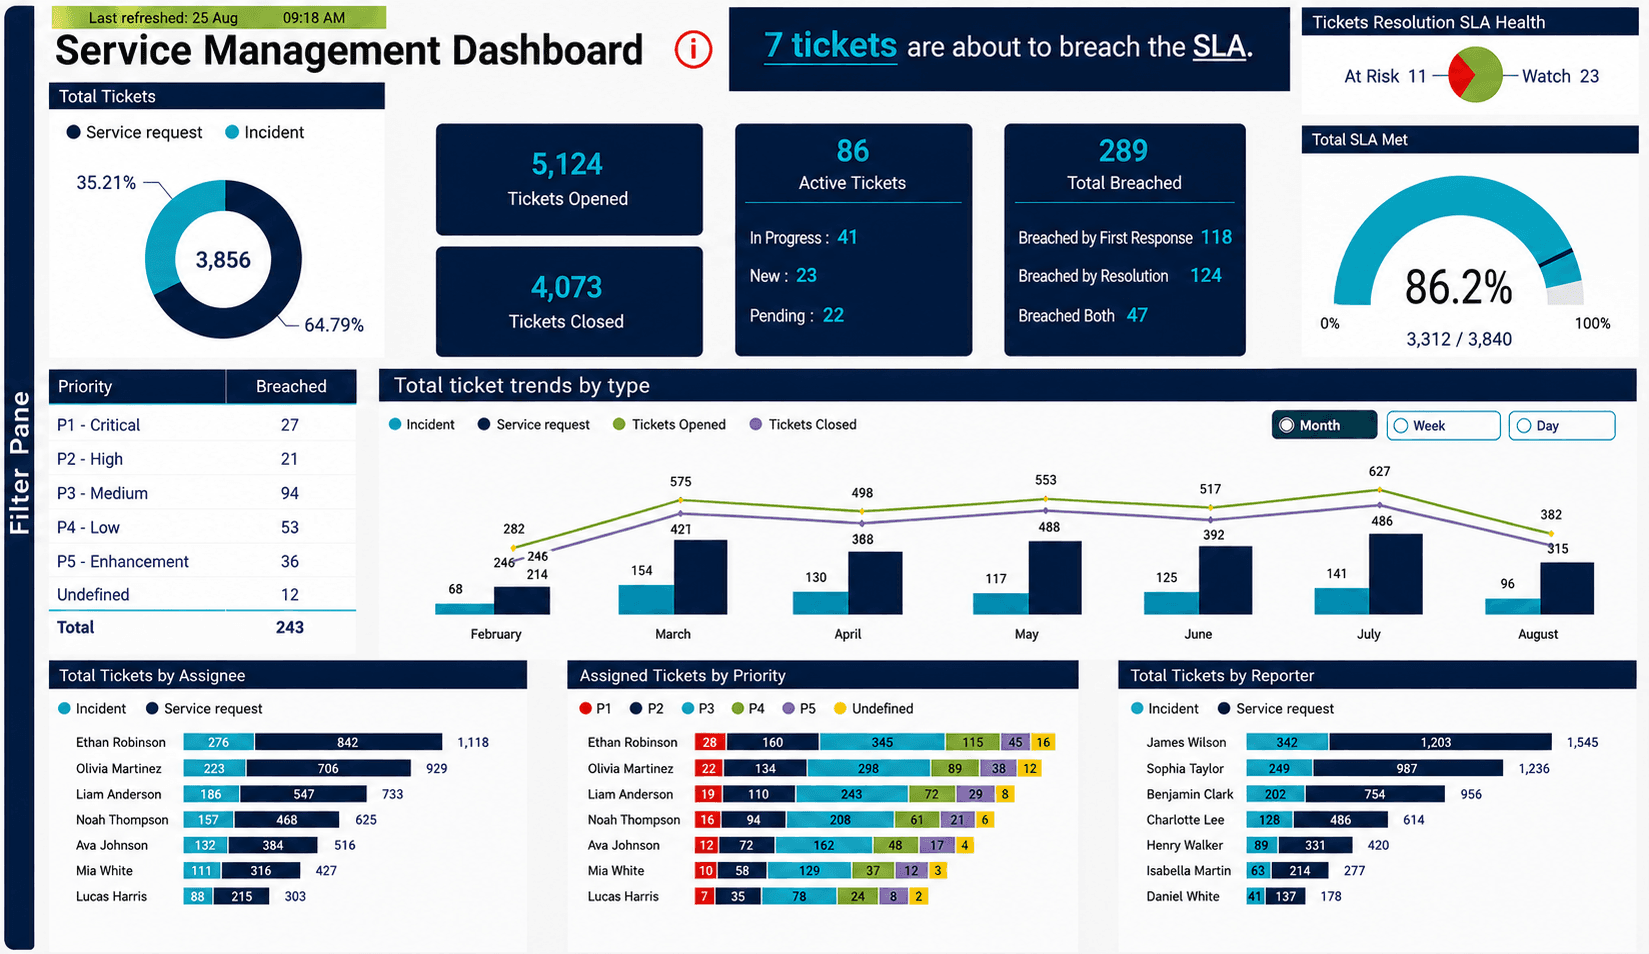
Screenshot of the Delta Table Ingestion & Lineage Audit dashboard

Delta Table Ingestion & Lineage Audit

Reverse-engineered an undocumented ADF-to-Databricks ingestion pipeline using history and lineage tooling, then replicated it safely in a dev environment.

DatabricksAzure Data FactoryADLS Gen2Dataverse
Pipeline documented
First time
Dev replication
Fully working
Team unblocked
Yes

Career

Experience

Where the process above has actually been put to work.

  1. Business Intelligence Developer · Skills Group

    2023 — Present · Auckland, NZ

    • Own end-to-end BI delivery across Power BI, Databricks/Unity Catalog, and Azure Data Factory for the organisation's LMS and compliance reporting.
    • Built stakeholder-facing dashboards adopted by campus managers across multiple regions, replacing manual spreadsheet reporting.
    • Diagnosed and resolved recurring data-type and lineage issues in production Delta tables, improving trust in compliance reporting.
    • Piloting Microsoft Fabric as a future evolution of the organisation's analytics platform.
  2. Business Application Specialist · IB4T

    2021 — 2023 · Auckland, NZ

    • Delivered SSRS paginated reports and ad-hoc SQL analysis for operational and finance stakeholders.
    • Automated recurring Excel-based reporting workflows, cutting manual turnaround from days to hours.
    • Partnered with cross-functional teams to define KPIs and reporting standards.

Foundation

Education

Bachelor of Information Technology

2007 — 2011

PNU University

Focus on databases, statistics, and information systems design.

Word of mouth

What people say

She didn't just hand us a dashboard — she sat with our team until we understood what the numbers meant for how we run campuses. That's rare.

Jordan Miller

Regional Operations Manager, Skills Institute

Get in touch

Let's turn your data into a decision

Have a dashboard that nobody trusts, or a question no one can answer with the data you have? I'd like to hear about it.

osouli.a@gmail.com
Auckland, New Zealand

Opens your email client. Wire this form up to an API route or a form service for in-page delivery.